How Photoperiod Timing Reshapes PV-Battery Sizing for Plant Factories

Source: Xiong et al., 2026, Energy and Buildings (In Press, JCR Q1)
Electricity costs account for 30-50% of plant factory operating expenses. Photoperiod timing matters as much as PV array size — a 40% battery reduction by shifting to early-morning hours.
Long-term deep cultivation of energy system optimization for plant environments
Highlights
- 🎯 Simulation framework: Established a joint PV, BES, and PFAL load optimization framework - Vertical Farm Energy Designer (VFED), validated against a full year of operational data from Shanghai
- 💡 Key finding: Systematically quantified the impact of photoperiod start time on PVBES configuration - found that photoperiod timing matters as much as PV array sizing for energy autonomy
- 📊 Benchmark data: Provided PVBES sizing benchmarks across 5 climate zones (Shanghai, Lhasa, Haikou, Harbin, Urumqi)
- 🚀 Open-source tools: Released the framework and datasets for researchers and practitioners to replicate and customize for local conditions
At a Glance
Electricity costs account for 30-50% of plant factory operating expenses - a core bottleneck to scaling. Existing PV-battery integration research for PFALs has two critical gaps: first, photoperiods are treated as fixed constraints rather than optimizable variables; second, there is a lack of empirically validated design benchmarks for specific system configurations.
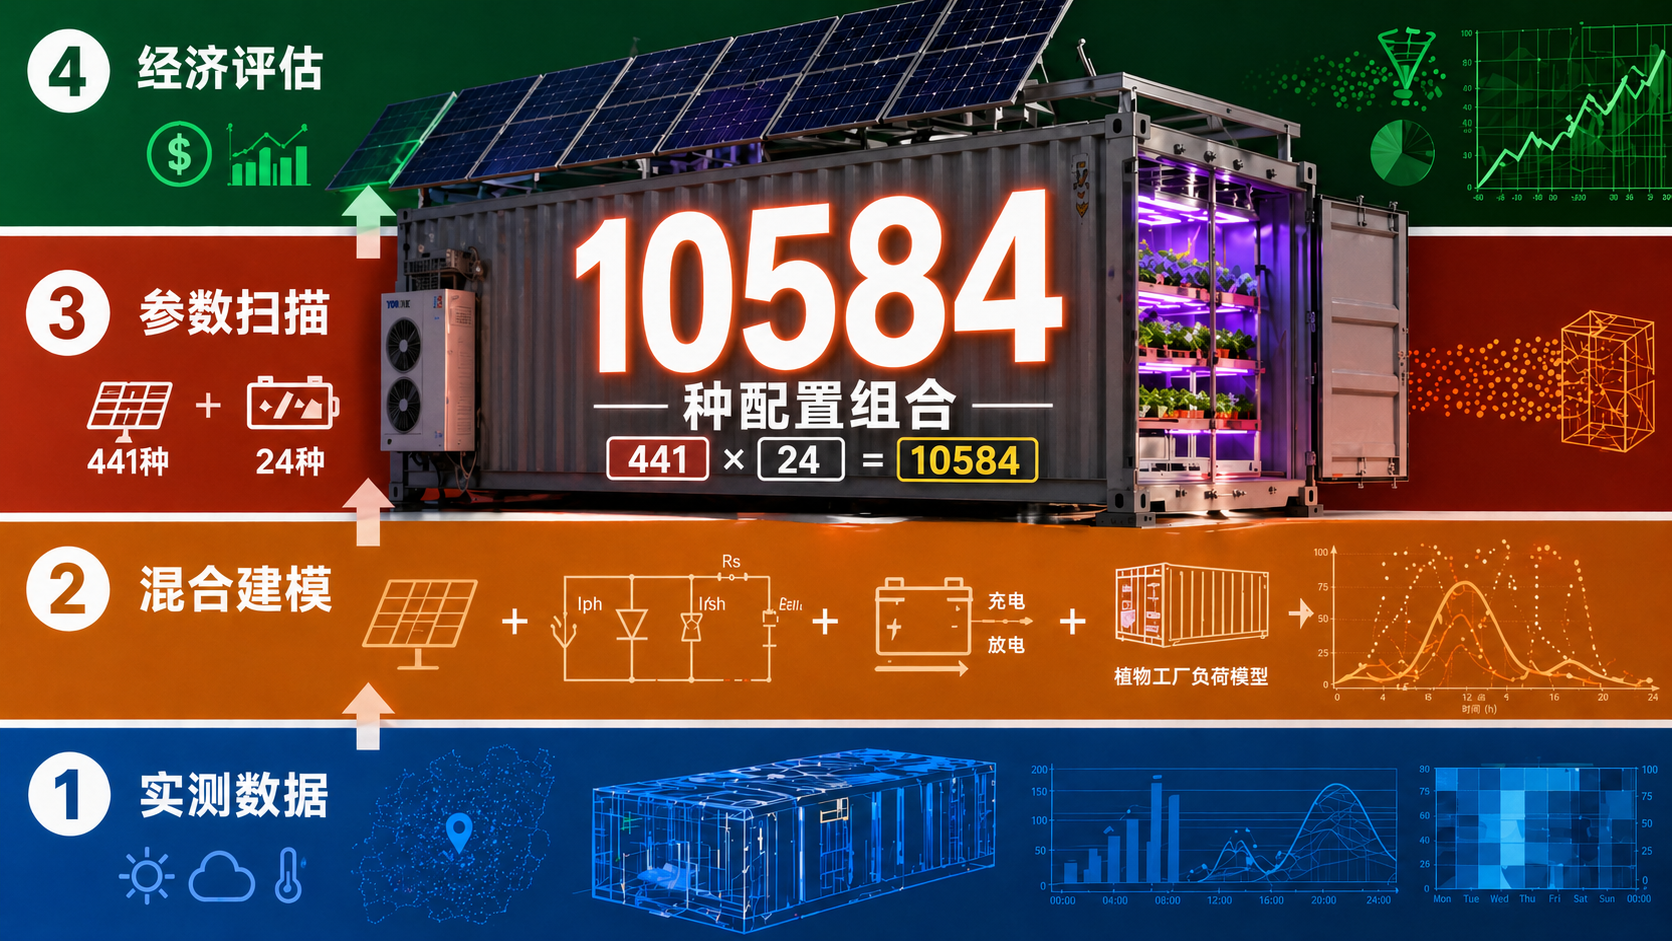
This study, led by Thomas Xiong and Hua Bao at Shanghai Jiao Tong University, establishes a joint simulation-optimization framework (VFED) integrating photovoltaic generation, battery storage, and plant factory loads. Validated against a full year of measured data, the framework was applied to systematically optimize across 10,584 configuration combinations spanning five representative climate cities.
The central finding: photoperiod timing is equally critical as PV array size for achieving energy autonomy. In Shanghai, shifting the photoperiod from a conventional evening schedule to an early-morning start (03:00-05:00) reduces required battery capacity by 40% while maintaining identical PV sizing. Across five cities, the minimum system for near-energy autonomy varies dramatically: a 20-foot container PFAL (16 m2 cultivation area) requires only 40 m2 PV + 40 kWh storage in Lhasa, but up to 120 m2 PV + 50 kWh storage in Harbin. This study provides a reproducible simulation framework and empirically grounded design benchmarks for PFAL energy system planning.
⏱ Body text ~6,200 chars | Estimated reading time: 16-20 minutes
Electricity eats half the profit of a plant factory
To understand why PFALs need PV integration in the first place, let us start with a simple question: how much of the operating cost does electricity actually consume?
Food security and the rise of plant factories
Recent extreme climate events and global pandemics have exposed the vulnerability of traditional food supply chains, driving the development of Controlled Environment Agriculture (CEA). Plant Factories with Artificial Lighting (PFALs), as the most efficient form of CEA, enable year-round crop production in fully enclosed environments, completely independent of external weather conditions. This holds significant implications for urban food supply, desert agriculture, and even space farming.
However, the “enclosed” nature of PFALs means that all growth conditions must be artificially provided. LED lighting systems simulate photosynthesis, and HVAC systems manage the substantial internal heat gain - all of which demand significant electricity input. According to research data, electricity costs account for 30-50% of PFAL operating expenses, making this the primary barrier to economic viability and large-scale adoption.
The PV + storage solution
An intuitive approach emerges: if PFALs consume so much electricity, why not generate it on-site? In recent years, PV-battery energy storage systems (PVBES) have seen rapid development. In residential and industrial microgrids, optimization methodologies typically focus on demand-side management to align flexible loads with solar availability, forming mature design workflows.
In agriculture, greenhouse-oriented PV research has made notable progress: some studies achieved 25.7% energy offset through PV, while others optimized hybrid PVBES and solar thermal systems to cover 51% of the electricity load, with economic analyses showing payback periods as low as six years. However, these studies target greenhouses - whose loads are primarily driven by weather-dependent heating and cooling demands, leaving virtually no room for load shifting.
By contrast, PFALs possess a distinct advantage: the timing of artificial lighting can be flexibly adjusted without compromising crop yield. Plant growth depends on cumulative Daily Light Integral (DLI), not on specific lighting hours. This creates an unprecedented optimization space for actively coordinating photoperiods with PV generation.
The research gap
Yet existing PFAL-PVBES research suffers from two critical limitations:
-
Overlooking temporal flexibility: Current studies treat photoperiods as fixed temporal patterns rather than optimizable variables. The conventional “nighttime photoperiod” strategy (e.g., starting at 18:00) creates a temporal mismatch between PV generation peaks and LED demand, forcing the system to store daytime solar energy in batteries for evening use - inflating storage requirements and incurring energy conversion losses.
-
Lack of design benchmarks: For a typical 20-foot container PFAL (16 m2 cultivation area), how much PV area and battery capacity are needed to achieve energy autonomy? Such concrete system sizing benchmarks are virtually absent from the literature.
This study addresses both gaps by providing an empirically validated simulation framework and multi-climate-zone design benchmarks for PFAL-PVBES systems.
One year of measured data + ten thousand enumerated configurations
The credibility of any simulation-based conclusion rests on its input data. To ensure the findings are not speculative, this study calibrated its models against a full year of operational measurements, then exhaustively enumerated over ten thousand configurations.
Integrated framework
The research team established a four-level integrated simulation-optimization framework: Vertical Farm Energy Designer (VFED).
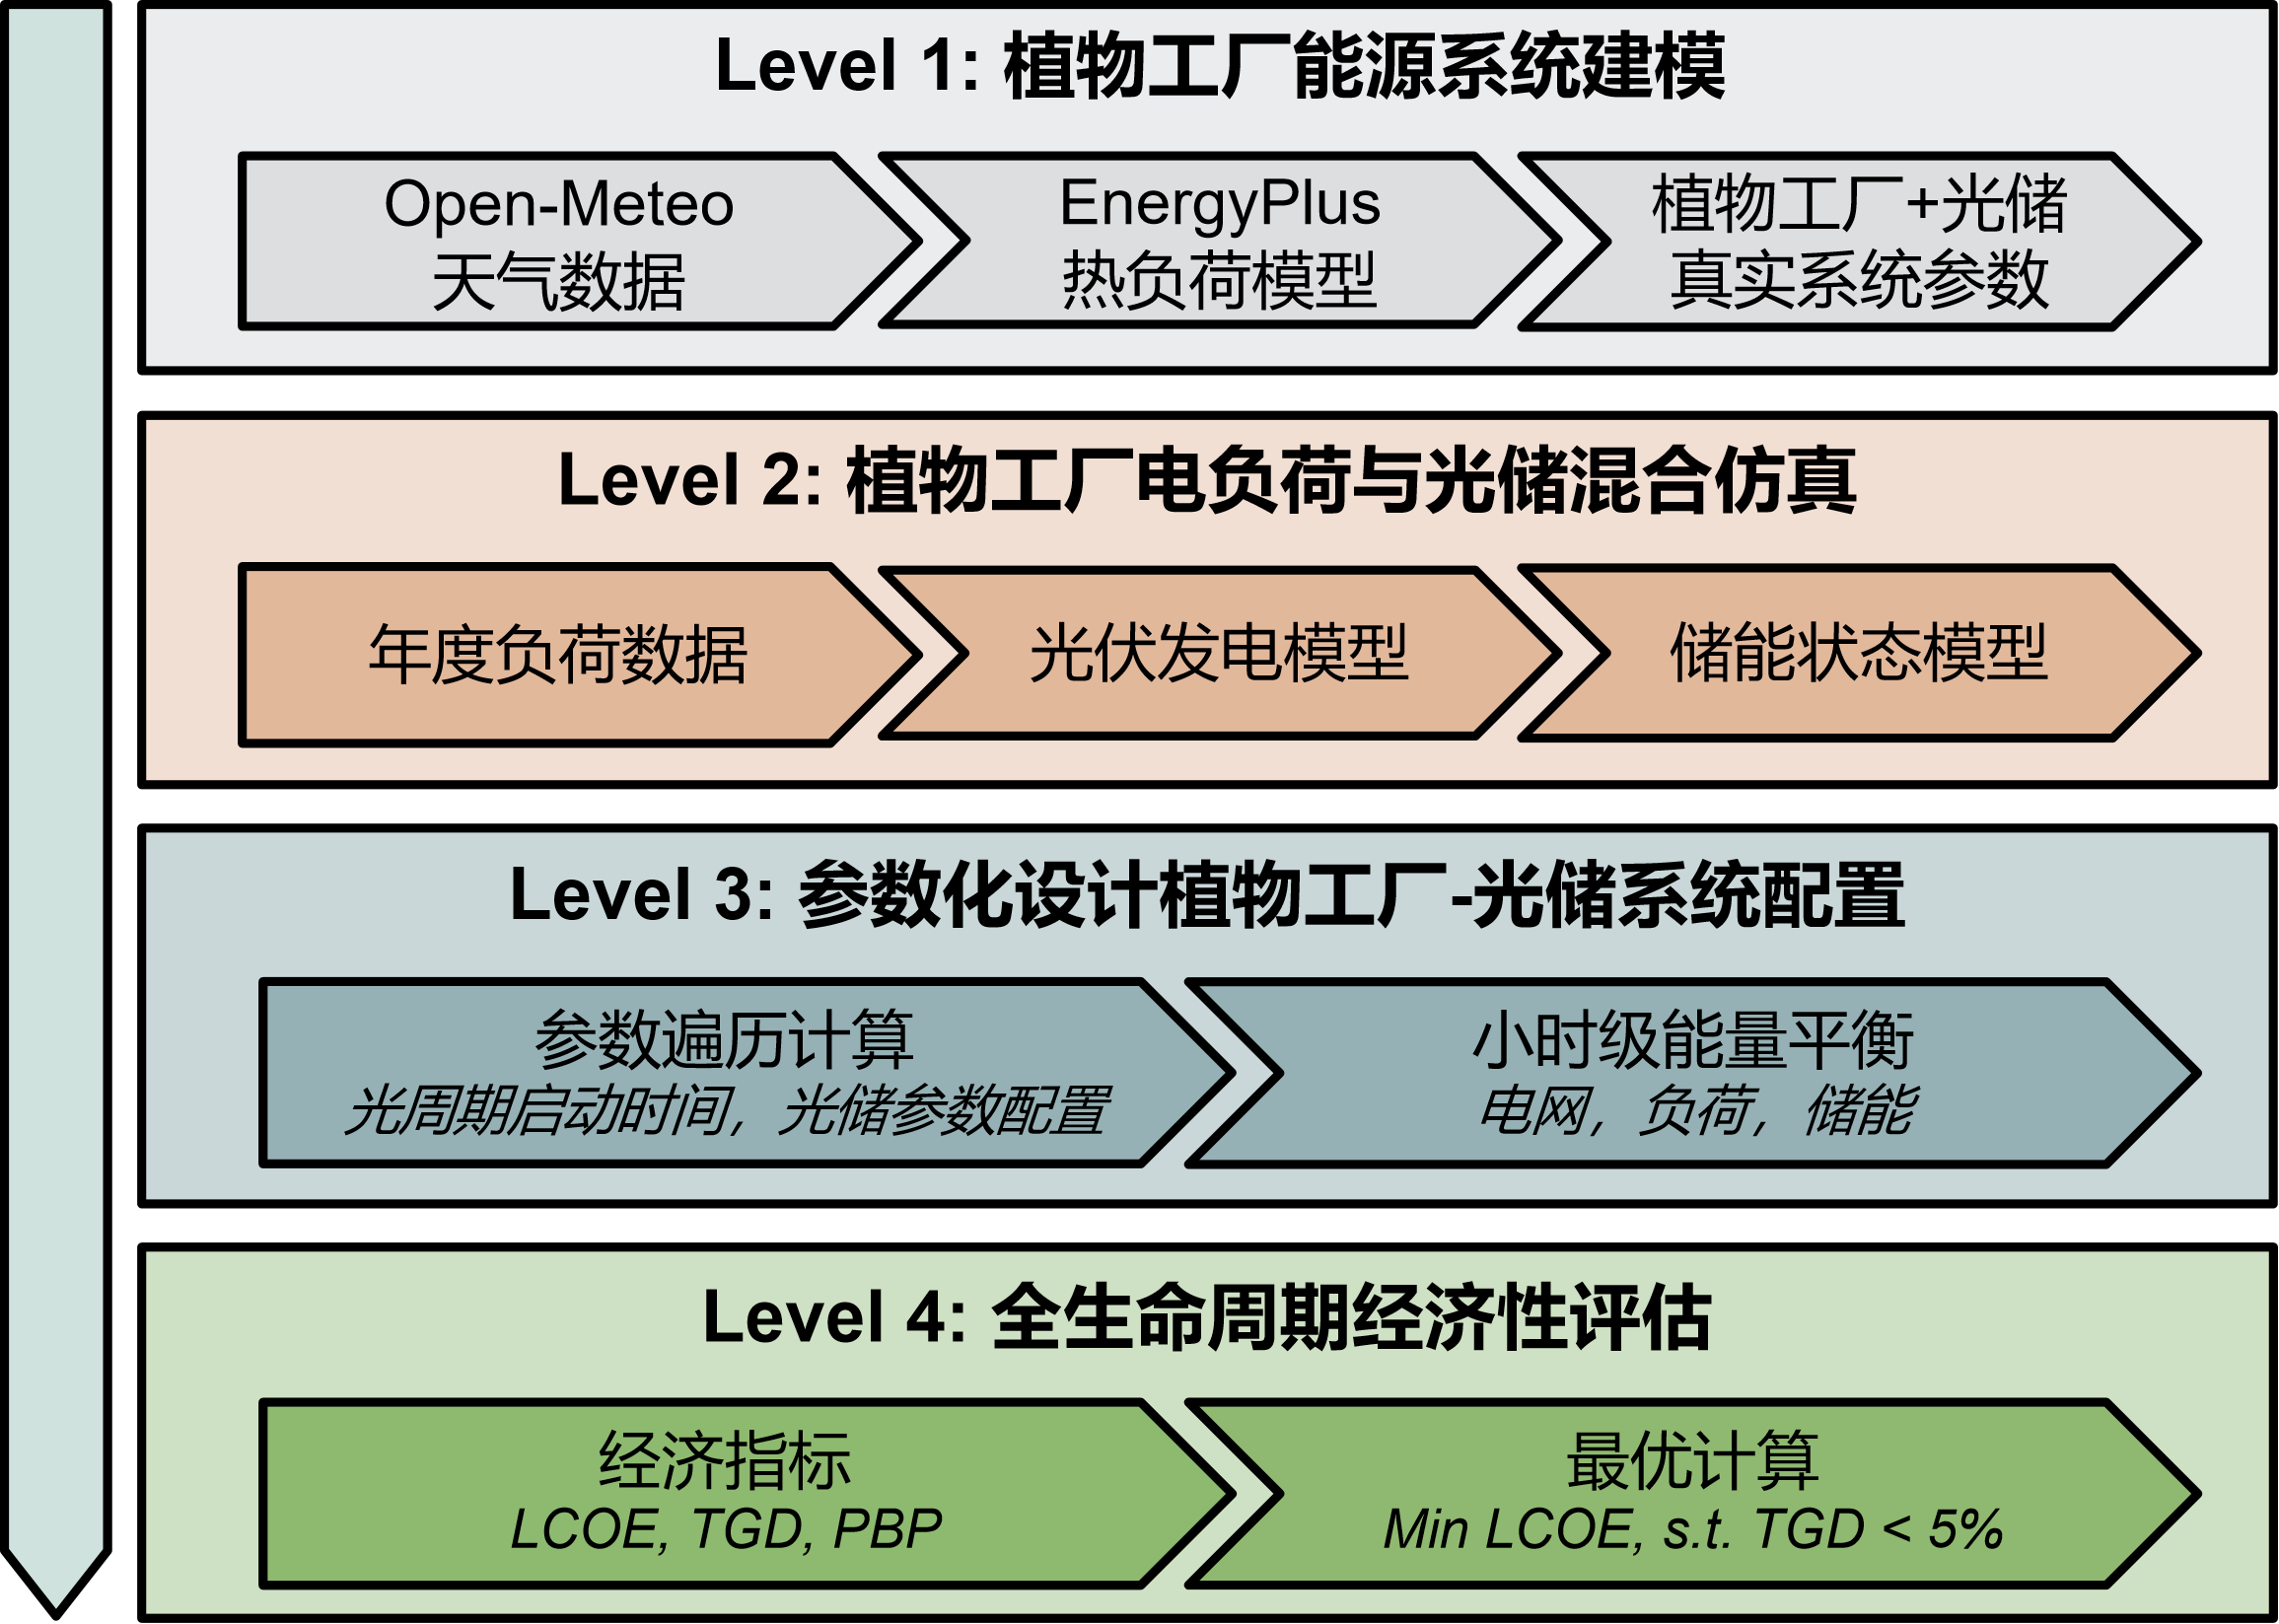
Level 1: Case study setup Local meteorological data are integrated with an EnergyPlus thermal model. A demonstrative 20-foot container PFAL in Shanghai serves as the baseline case, with its parameters validated against measured data.
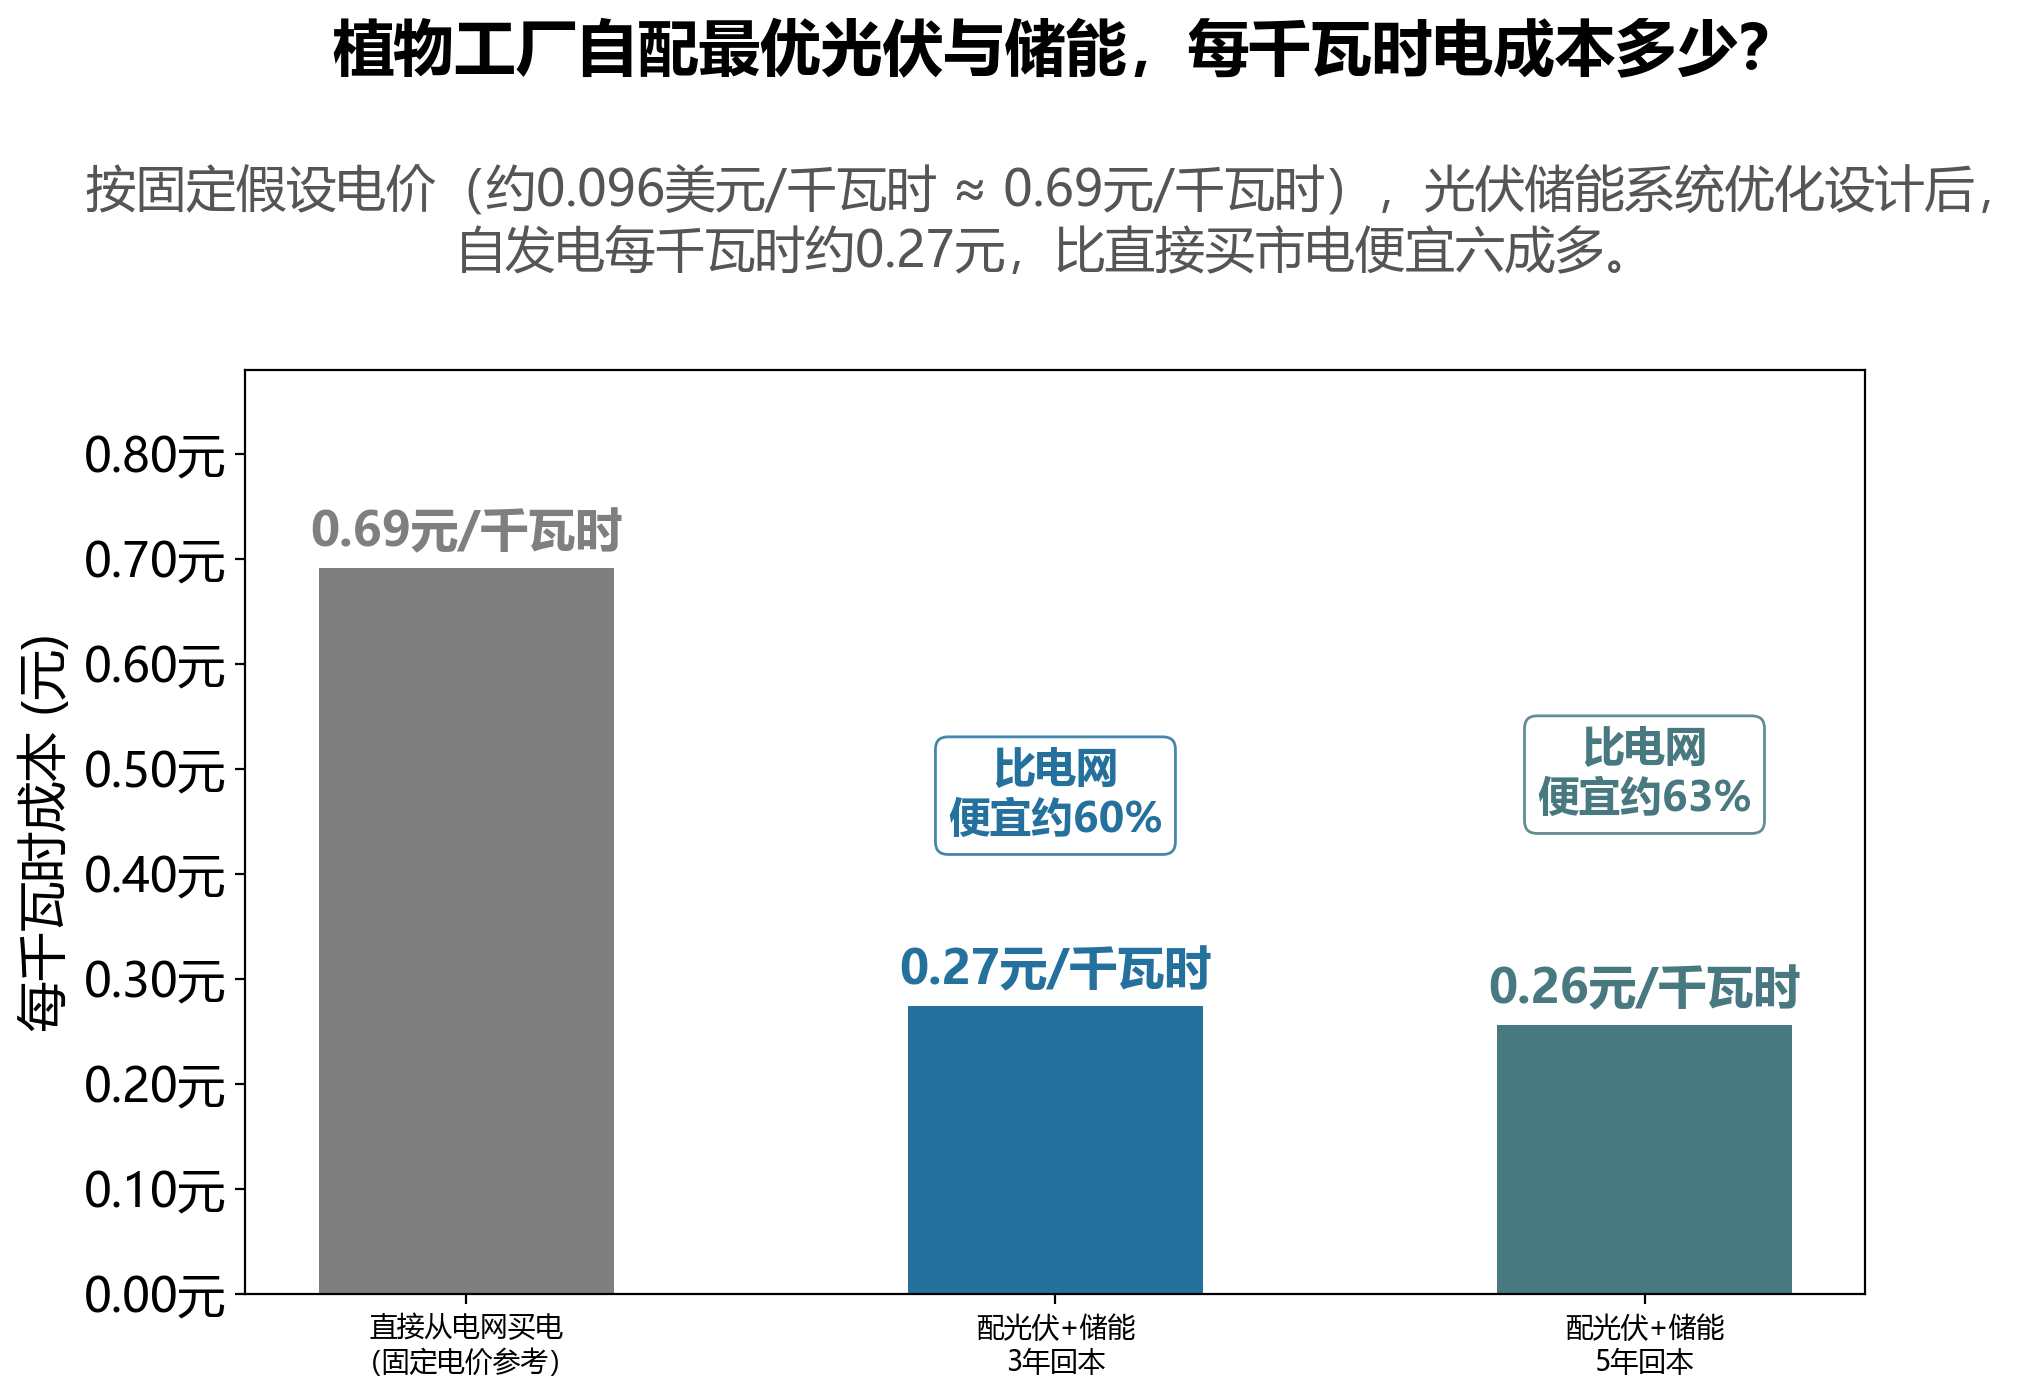
Level 2: Hybrid modeling A dynamic energy flow model incorporating PV generation, BES, and PFAL loads is constructed. The PV modules use a single-diode model; the BES model accounts for charge/discharge efficiency. PV module parameters are sourced from Jinko Solar official specifications, BES parameters from CATL official specifications. Grid electricity price is simplified to a uniform fixed rate (0.096 $/kWh).
Level 3: Design optimization A parameter sweep across photoperiod timing and system sizing is executed, ensuring hourly energy balance. Through systematic optimization, the optimal solution is identified among 10,584 configuration combinations (441 PVBES configurations x 24 photoperiod start hours).
Level 4: Economic evaluation The optimal design is identified by minimizing the Levelized Cost of Energy (LCOE).
Operational data monitoring
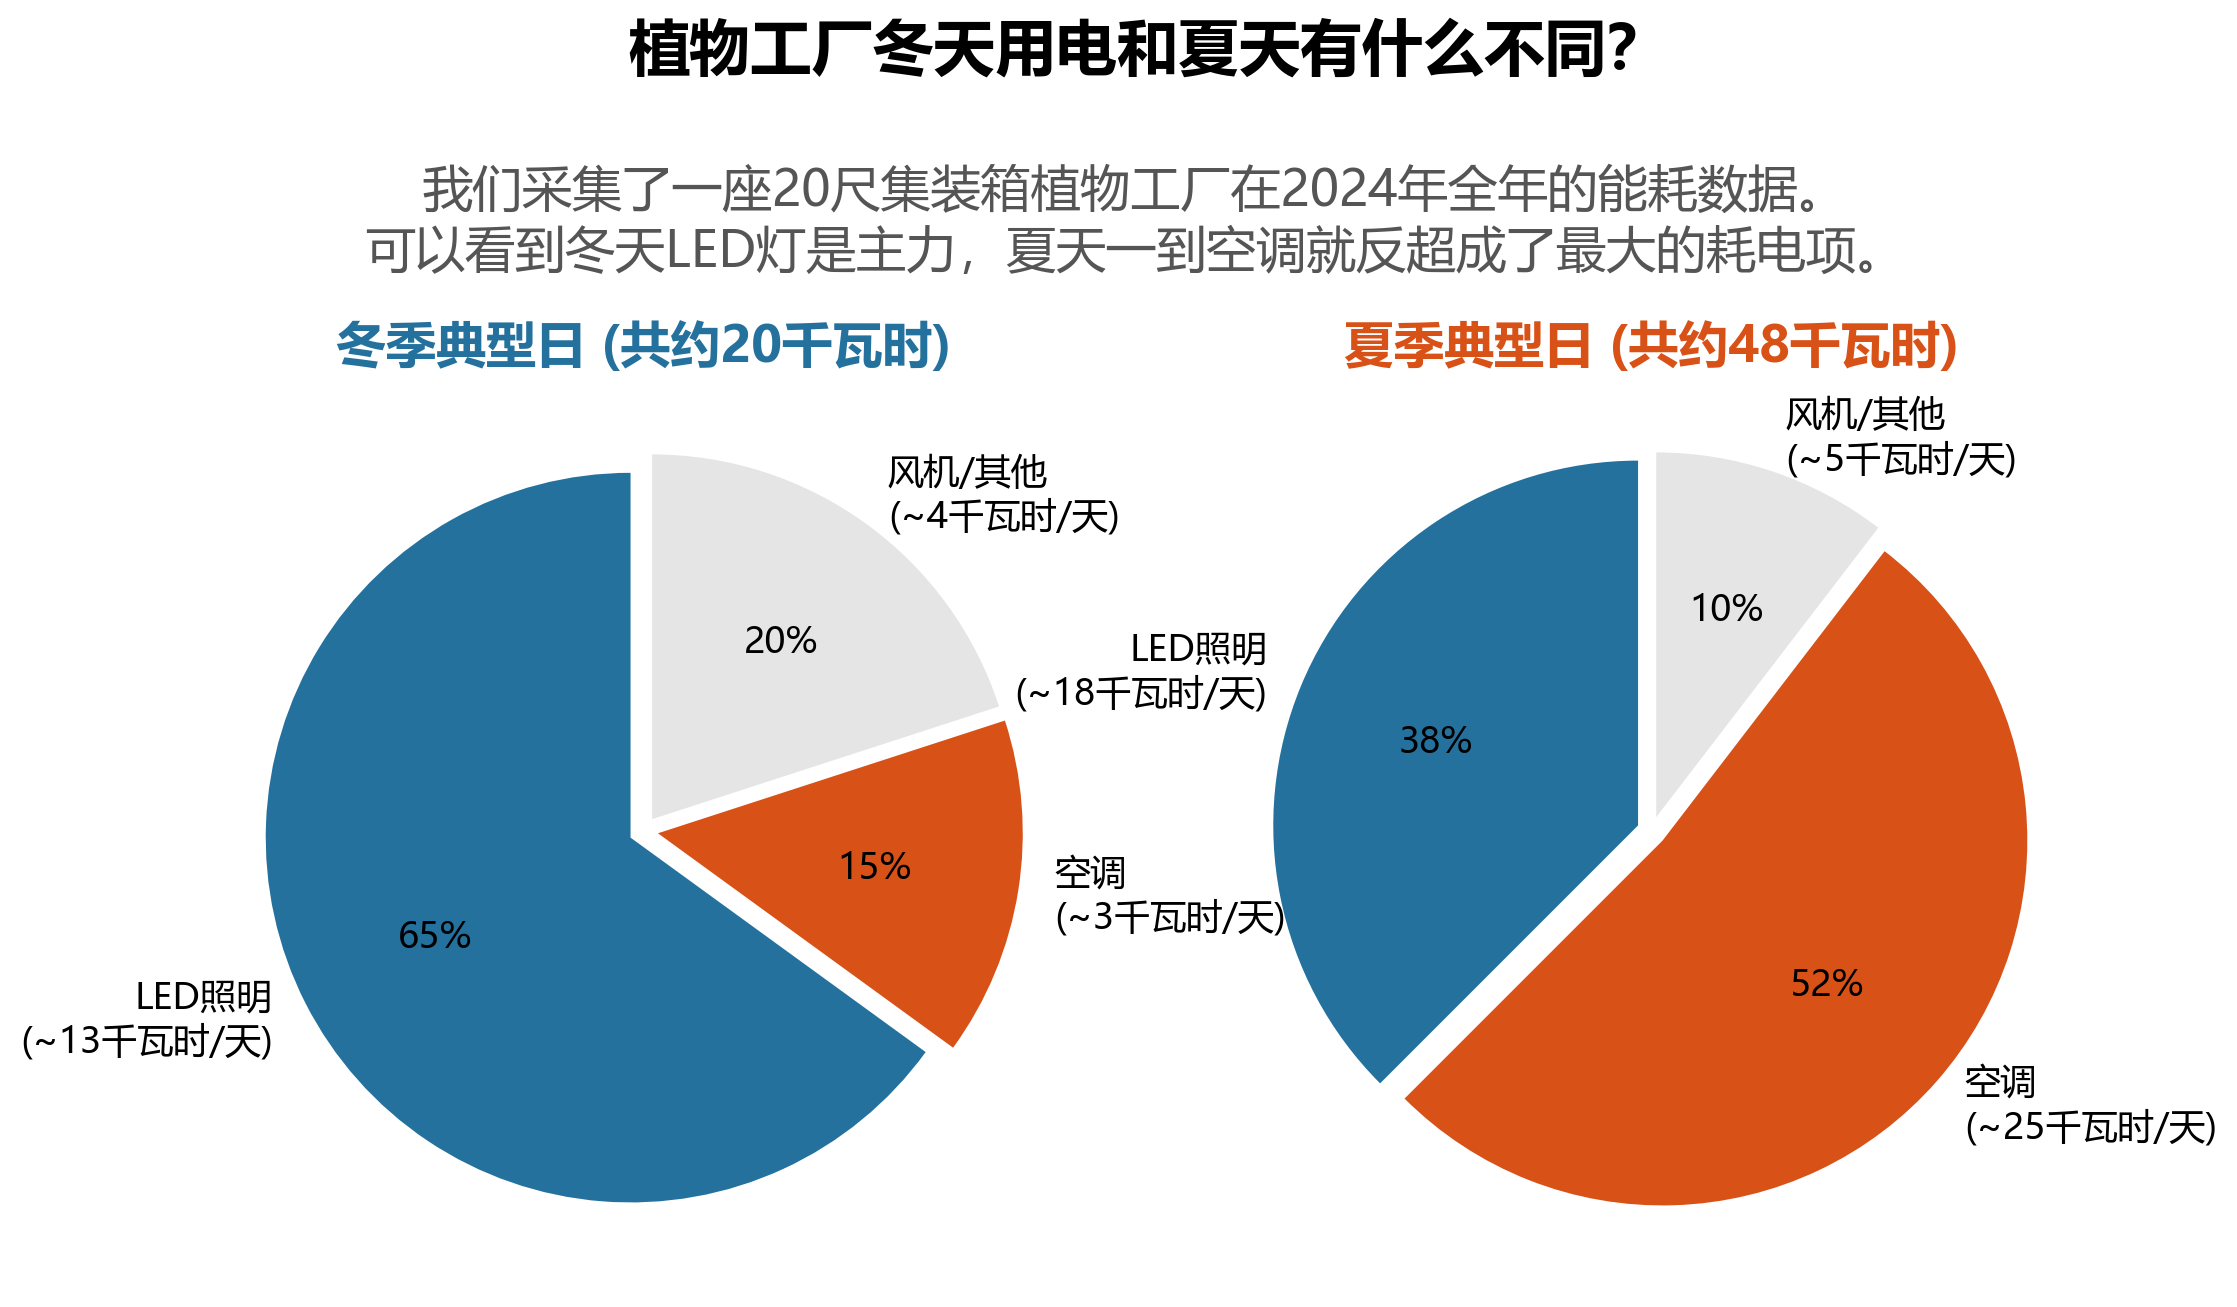
The research team monitored a 20-foot container PFAL in Shanghai for a full year (January-December 2024), collecting energy consumption data for LED lighting, air conditioning, fan filter units, and fresh air units at a 1-hour resolution.
Measured data reveal:
- Total energy consumption exhibits seasonal variation: ~20 kWh/day in winter, peaking above 45 kWh/day in summer and early autumn
- Air conditioning is the dominant source of consumption fluctuation: <5 kWh/day in winter, up to 25 kWh/day in summer
- LED lighting is relatively stable: 10-20 kWh/day, adjusted according to crop growth requirements
Seasonal COP values for the air conditioning system: winter 3.94, spring 3.85, summer 2.73, autumn 2.57. The low energy consumption and high COP in winter/spring are primarily due to heat dissipation from LED and other equipment offsetting heating demand.
Optimization methodology
The study defines two key economic metrics:
Levelized Cost of Energy (LCOE) - the unit cost of electricity consumed: $$LCOE = \frac{\sum_{t=1}^{T}\frac{I_t + M_t - G_t}{(1+r)^t}}{\sum_{t=1}^{T}\frac{E_t}{(1+r)^t}}$$
Payback Period (PBP) - the ratio of total capital cost to annual savings.
And two energy autonomy indicators:
Time-based Grid Dependency (TGD) - the proportion of hours within a year requiring grid supply. TGD < 5% is defined as “near-energy autonomy.”
Energy-based Grid Dependency (EGD) - the proportion of annual total energy demand imported from the grid.
Industry insight: The importance of measured data
A key strength of this study is its use of a full year of operational data to validate model parameters, rather than relying on literature values or estimates. This is critical for accurately simulating air conditioning loads under different climatic conditions - daily AC consumption varies substantially across locations (from ~21 kWh/day in Shanghai to ~24 kWh/day in Haikou). Using an inaccurate load model would lead to fundamentally flawed system sizing.
One container, threefold difference between Lhasa and Harbin
How much can PVBES configuration requirements differ for the same container PFAL deployed in different cities? To answer this, the study selected five extreme climate zones for comparison - the result: a threefold difference.
Climate characteristics and energy analysis
The study selected five representative cities across China’s climate zones: Shanghai (subtropical), Harbin (severely cold), Haikou (tropical), Lhasa (plateau), and Urumqi (temperate continental).
Solar resource distribution: Lhasa receives the highest annual average (5.88 kWh/m2/day), followed by Haikou (4.72), Urumqi (4.21), with Harbin the lowest (3.81 kWh/m2/day). Seasonally, solar resource availability peaks in spring and summer, but Urumqi’s high latitude (~43.8N) drastically shortens winter daylight hours, reducing winter solar radiation to levels comparable with Harbin (~2.2 kWh/m2/day).
Temperature distribution: Haikou exhibits the highest annual mean temperature (~25.5C) with minimal seasonal variation; Harbin averages only ~5.7C with extreme seasonal swings.
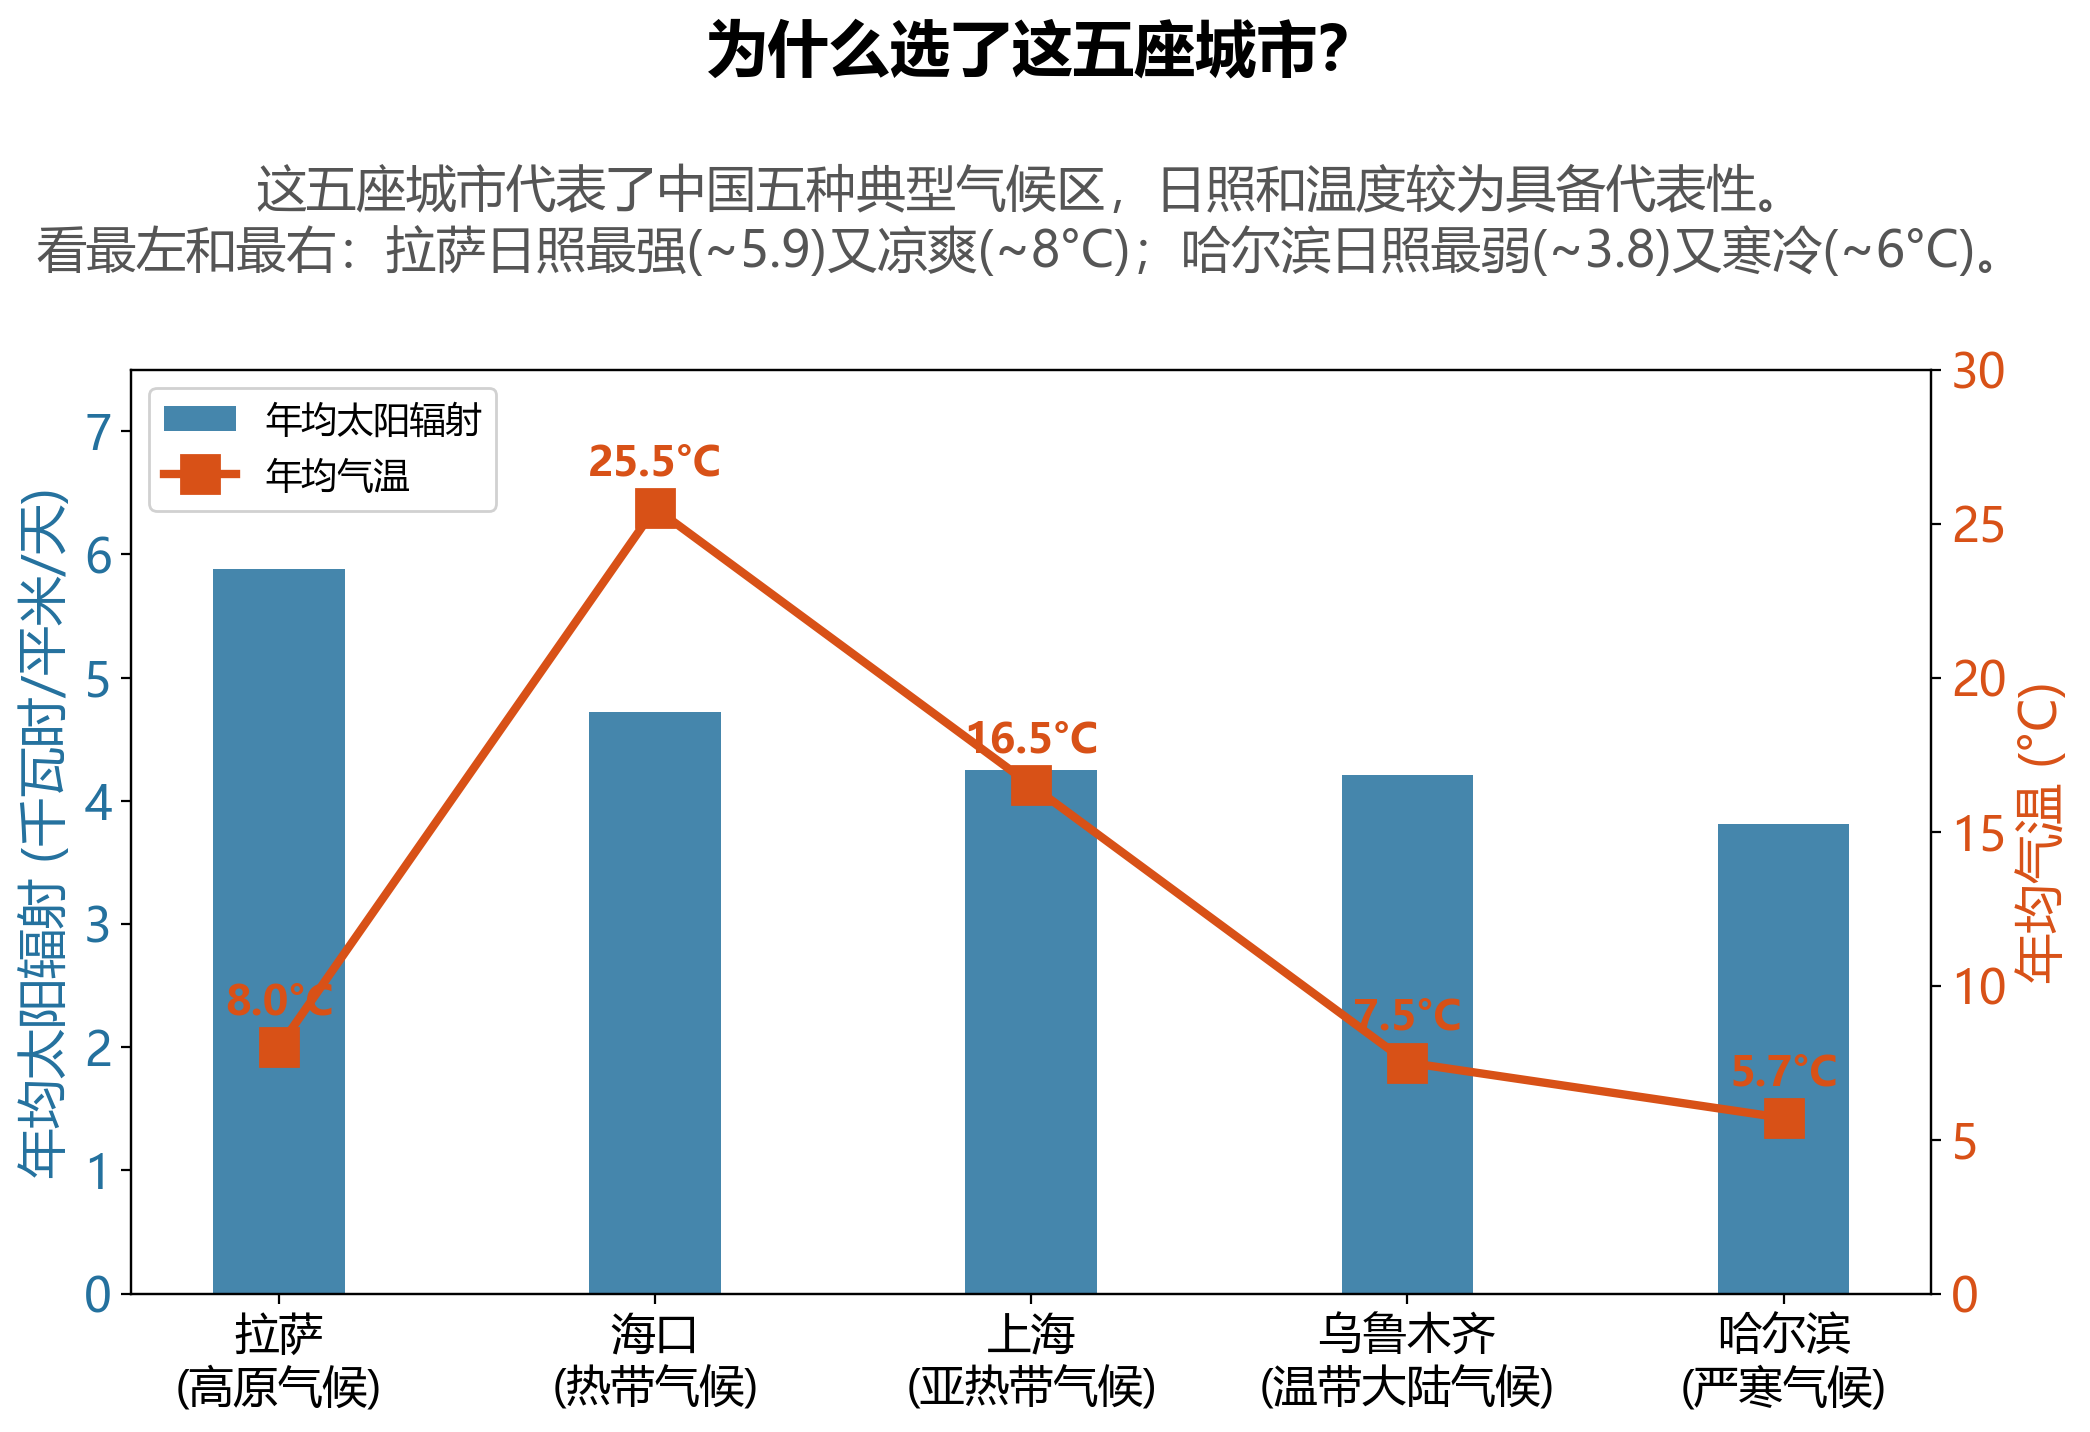
Air conditioning energy projection: Haikou and Shanghai show the highest AC energy consumption (~24 and 21 kWh/day), reflecting greater cooling demand in warmer climates. Lhasa has the lowest projected AC requirement (~18 kWh/day) - despite moderate temperatures, the high-altitude nighttime cooling reduces overall cooling pressure.
Energy autonomy design boundaries
The study first addresses a critical question: can a PVBES fully meet the energy demand of a PFAL?
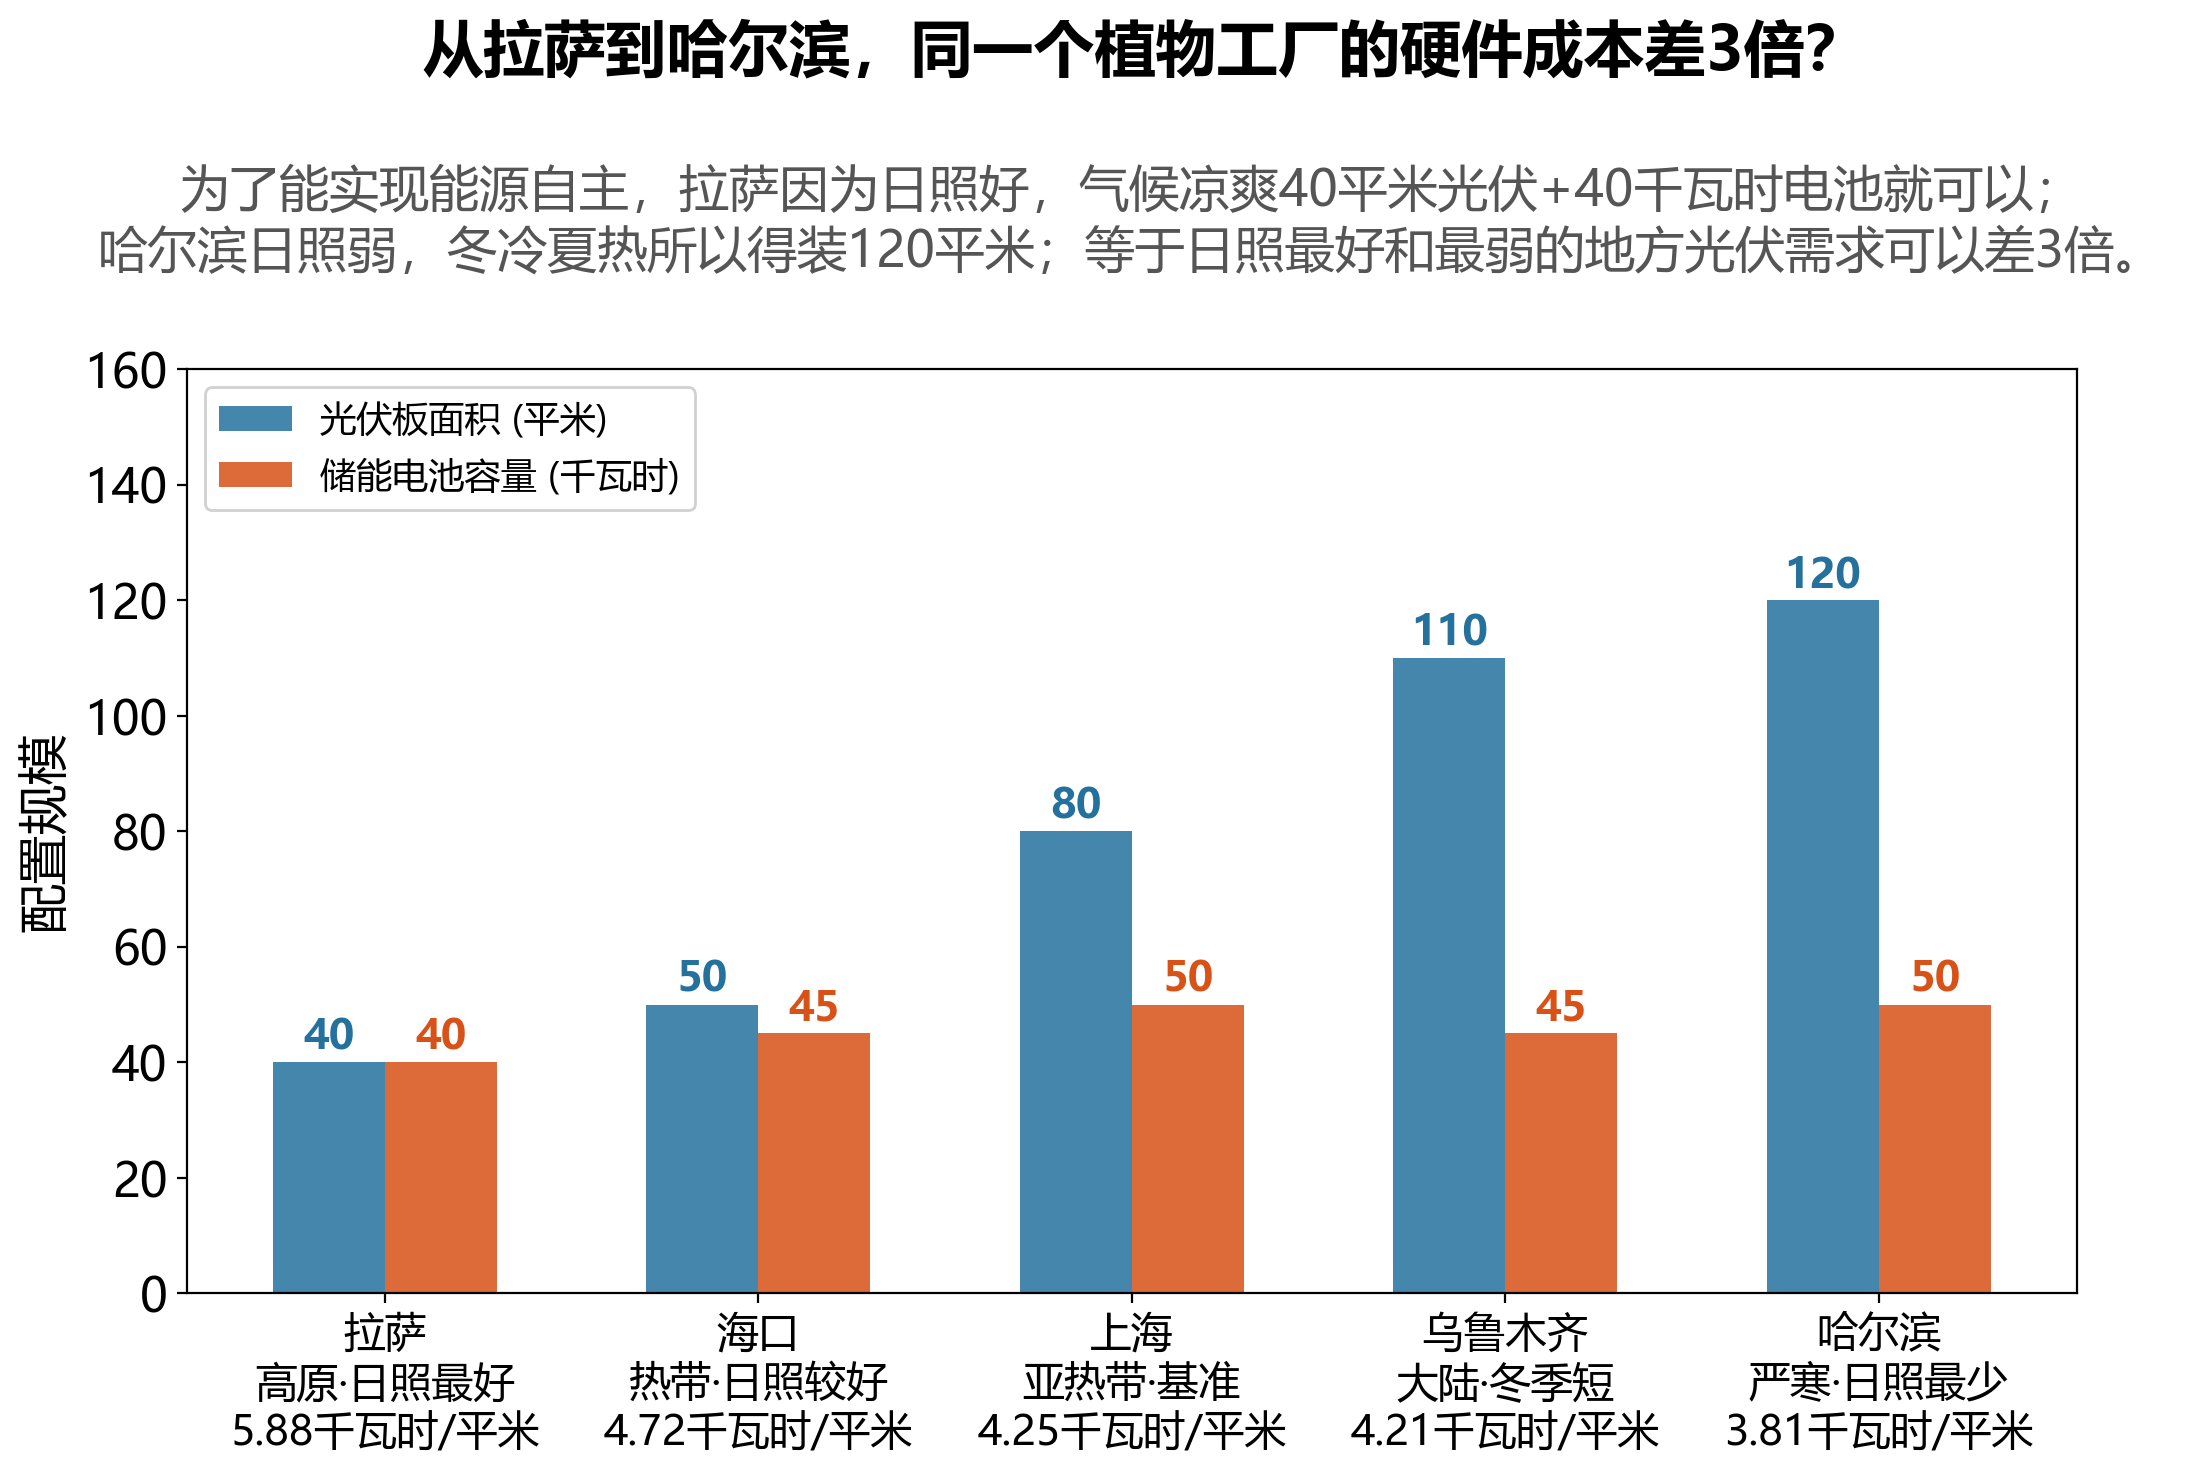
Key finding: For a 20-foot container PFAL (16 m2 cultivation area), achieving TGD < 5% near-energy autonomy requires dramatically different system configurations across cities:
| City | PV Array Area | Battery Capacity |
|---|---|---|
| Lhasa | 40 m2 | 40 kWh |
| Haikou | 50 m2 | 45 kWh |
| Shanghai | 80 m2 | 50 kWh |
| Urumqi | 110 m2 | 45 kWh |
| Harbin | 120 m2 | 50 kWh |
Lhasa requires the smallest configuration, benefiting from its abundant solar resources and lower cooling demand. While Urumqi’s annual solar resource (4.21 kWh/m2/day) surpasses both Harbin (3.81) and Shanghai, its configuration requirement remains high at 110 m2 - the key lies in winter: high-latitude short daylight hours reduce winter solar resources to levels comparable with Harbin (~2.2 kWh/m2/day), severely driving up the annual configuration requirement. This demonstrates that annual average solar resource alone cannot explain configuration differences - seasonal fluctuations and winter troughs are the critical bottleneck.
Impact of photoperiod timing: Analysis reveals that photoperiod start time significantly affects system reliability. Early-morning starts perform optimally. For example, in Lhasa, the mean TGD for starts at 01:00-03:00 is approximately 11%, compared to 15.01% for 17:00-19:00 starts.
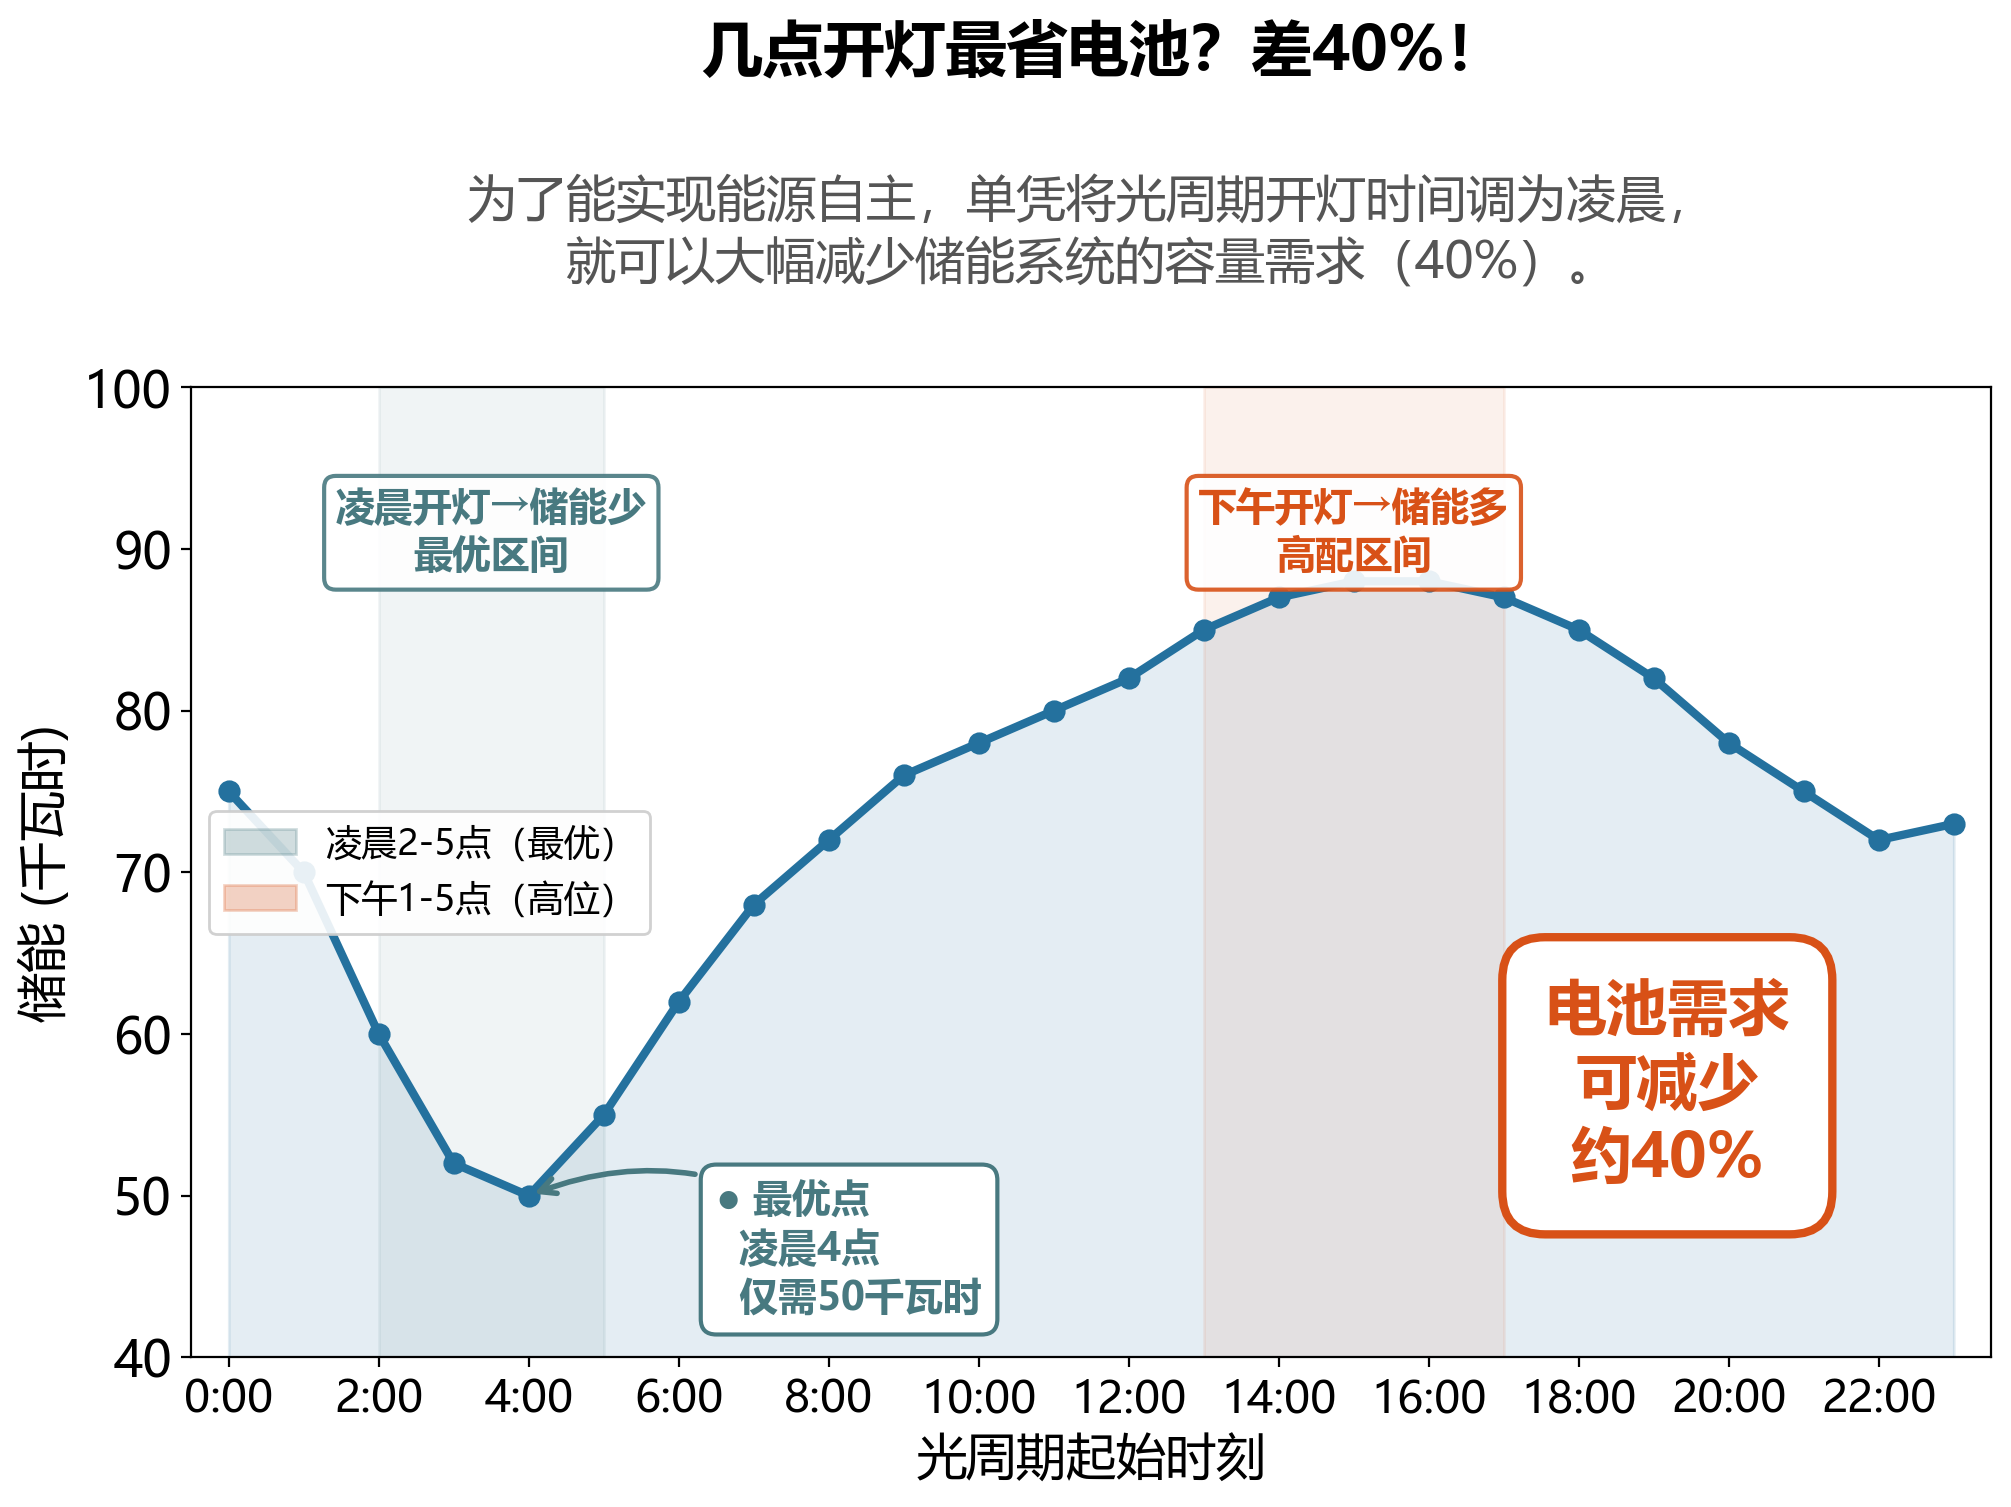
Shanghai detailed analysis: In Shanghai, the minimum viable PV array area remains relatively uniform across different photoperiod start hours (86.5 +/- 4.9 m2), but BES capacity requirements vary dramatically (78.5 +/- 20.7 kWh). Morning photoperiods (02:00-06:00) require only 50-60 kWh storage, while afternoon photoperiods (13:00-19:00) require 80-90 kWh. By strategically aligning the photoperiod with solar peak hours, BES capacity requirements can be reduced by 40% while maintaining identical PV sizing.
Industry insight: The engineering significance of 40% storage reduction
A 40% reduction in battery capacity carries substantial engineering implications. For a 100 kWh storage system, this translates to approximately $12,000-18,000 in upfront capital savings.
Optimized PVBES design can slash electricity costs to one-third
Feasibility alone is insufficient - the economics must also justify the investment. To verify this, every configuration was passed through the LCOE filter.
Economic optimization results
LCOE performance: Systems designed for a 3-year payback period achieve LCOE values ranging from 0.034-0.042 $/kWh, representing a 57-61% reduction compared to the assumed grid electricity price of 0.096 $/kWh. When extending to a 5-year payback period, LCOE further decreases to 0.032-0.039 $/kWh, delivering savings of 59-67%.
Lhasa consistently outperforms all other locations, attributable to its optimal combination of abundant solar radiation and moderate temperature profile - simultaneously maximizing PV generation efficiency and minimizing PFAL cooling energy requirements.
Optimal system configurations (20-foot container PFAL):
| PBP Target | City | PV Area | BES Capacity | LCOE | Savings |
|---|---|---|---|---|---|
| 3-year | Lhasa | 80 m2 | 60-100 kWh | 0.034 $/kWh | 65% down |
| 3-year | Shanghai | 100 m2 | 80-100 kWh | 0.042 $/kWh | 56% down |
| 5-year | Lhasa | 60-150 m2 | 100-145 kWh | 0.032 $/kWh | 67% down |
| 5-year | Shanghai | 80-150 m2 | 100-145 kWh | 0.039 $/kWh | 59% down |
Grid electricity price baseline: 0.096 $/kWh. Ranges reflect optimal configurations under different photoperiods.
Optimal photoperiod start time: Nearly all cities converge on 03:00 or 04:00 as the optimal start time. This is not coincidental - with a 16-hour photoperiod, lighting ends at ~20:00, and an early-morning start allows peak LED demand to coincide with the solar generation peak from midday through 16:00. PV output directly powers the LEDs, with surplus energy stored for later use.
Industry insight: Why conventional nighttime strategies fail
Existing research often recommends shifting PFAL photoperiods to nighttime hours (e.g., starting at 18:00) to exploit off-peak electricity prices. However, when combined with PVBES, this strategy introduces a temporal mismatch penalty: daytime PV peak output cannot be directly utilized and must first be stored, then discharged in the evening - incurring approximately 15% round-trip conversion losses. In contrast, the early-morning strategy enables direct PV self-consumption during peak hours, with storage serving only as backup.
Conclusion: Shifting the photoperiod saves an entire storage system’s worth of cost
Conclusions are only as robust as the numbers behind them. To confirm that the core findings withstand scrutiny, the study conducted a systematic uncertainty assessment of the entire simulation.
Uncertainty analysis
The study systematically evaluated model uncertainties. Based on measured data, the PV model accuracy achieves R2 = 0.992 (+/-3% error), the PFAL energy consumption model R2 = 0.908 (+/-10% error), and the BES model is assigned +/-2% error based on manufacturer specifications. Using the Root Sum of Squares method for error propagation, the composite system uncertainty is approximately +/-11%.
Sensitivity analyses further confirm the robustness of core conclusions: even under severe battery degradation (efficiency reduced to 80%), the 04:00 photoperiod strategy retains a 46.9%-57.8% LCOE advantage over the 13:00 strategy.
The core value of sizing-scheduling coordination
The central contribution of this study lies in establishing that photoperiod scheduling is as critical as PVBES component sizing. This finding carries significant engineering implications:
-
Substantial expansion of the optimization space: Previously, design optimization focused solely on “how large the PV array and battery should be.” Now, “when to turn on the lights” becomes an additional optimization lever - effectively doubling the number of optimization variables and providing greater freedom to reduce system cost or enhance performance.
-
Nonlinear reduction in storage requirements: Through active temporal alignment, BES capacity requirements can be reduced by 40%. This not only lowers upfront capital investment but also reduces battery footprint and thermal management burden. (This conclusion has been validated through battery degradation robustness testing: even at 80% efficiency, the early-morning photoperiod strategy retains a 46.9%-57.8% advantage over the conventional midday strategy - see Appendix B.)
-
Fundamental distinction from other flexible loads: Conventional building microgrid loads are largely fixed in time, whereas PFAL loads (LED lighting) possess temporal adjustability. This unique characteristic enables PFALs to achieve energy coordination outcomes unattainable in traditional microgrids.
Regional differences and siting guidance
Lhasa (high irradiance + cold temperatures): The lowest configuration requirement. Annual average solar resource of 5.88 kWh/m2/day combined with plateau low temperatures ensures high PV generation while minimizing cooling energy. 40 m2 PV + 40 kWh BES achieves near-energy autonomy.
Shanghai / Haikou (moderate irradiance + warm temperatures): Larger PV areas required. Moderate solar resources but higher cooling demand. Shanghai requires 80 m2 PV + 50 kWh BES; Haikou requires 50 m2 PV + 45 kWh BES.
Harbin / Urumqi (low irradiance + extreme temperatures): Higher configuration requirements. Winter solar resource declines sharply, while low temperatures (Urumqi) or high cooling demand (Harbin) drive up energy consumption. 110-120 m2 PV and 50 kWh BES are needed for near-energy autonomy. (Note: This study adopts simplified seasonal-fixed COP modeling, validated against an hourly COP model: cold-region deviation -14.5%, hot-region +17.2%, with monthly economic impact within +/-$13/month - all within the +/-11% global uncertainty range. See Appendix A.)
Empirical coefficients per m2 of cultivation area:
- PV requirement: 2.5-7.5 m2/m2 cultivation area
- Storage requirement: 2.5-3.1 kWh/m2 cultivation area
The scaling challenge
The study reveals a critical practical constraint: the optimal PV array area (80-150 m2) far exceeds the container footprint itself (~15 m2). This gap presents two response pathways:
Pathway 1: Solve the space problem - deploy PV arrays above containers, adopt “agrivoltaic” models with elevated ground-mounted PV above PFAL installations, or utilize expansive rooftops of multi-story industrial or commercial buildings for vertical integration.
Pathway 2: Identify more feasible suboptimal solutions - under real-world land constraints, the VFED simulation platform can re-optimize within spatially bounded conditions. Typical suboptimal strategies include prioritizing storage adequacy for nighttime supply, or accepting moderately increased grid dependency (TGD relaxed from <5% to <15%) in exchange for a >50% reduction in PV footprint. Calculations show that relaxing the TGD target to 10% reduces Harbin’s PV area requirement from 120 m2 to approximately 70 m2, substantially improving feasibility.
When transitioning from single-unit to large-scale commercial deployment, operators can aggregate multiple cultivation modules and centralize BES to share capital costs. The VFED framework developed in this study supports such scaling analyses and scenario optimization.
This study systematically investigates the impact of photoperiod scheduling flexibility on PFAL-PVBES system design, providing simulation tools and benchmark data for the field. The main contributions are:
1. An empirically validated simulation framework and benchmark data
Based on a full year of measured data, a joint PV-storage-load simulation-optimization framework (VFED) was established, with design references across five climate zones: for a 16 m2 cultivation area 20-foot container PFAL, achieving TGD < 5% requires configurations ranging from 40 m2 PV + 40 kWh BES in Lhasa to 120 m2 PV + 50 kWh BES in Harbin.
2. Systematic quantification of photoperiod scheduling impact
The early-morning photoperiod strategy (03:00-05:00) reduces BES requirements by 40% while maintaining identical energy autonomy levels, lowering LCOE to as low as 0.034 $/kWh - a 57-67% reduction compared to grid electricity prices.
3. Identified pathways to scaling
PV array requirements (80-150 m2) typically far exceed container footprints, suggesting that future deployments should prioritize rooftop vertical integration or agrivoltaic configurations.
4. Open-source release to advance future research
The complete VFED simulation-optimization framework has been released as open-source, inviting researchers and practitioners to further optimize and apply these models based on local climatic and economic conditions.
About Shi-Mo-Si-Yuan
Shi-Mo-Si-Yuan (SMART Energy Origin) originated from the Pan-Origin Institute of Future Technology at Shanghai Jiao Tong University, jointly incubated with CATL, with a long-term commitment to advancing energy system optimization tailored to plant environments.
The team focuses on the four-dimensional energy coupling of light, temperature, humidity, and airflow within controlled environments. Centered around a portfolio of proprietary intellectual property and know-how, they deliver full-chain solutions spanning system design, simulation optimization, and control strategy development.
Plant factories represent the team’s current application focus - where they have accumulated comprehensive energy optimization capabilities encompassing lighting scheduling, HVAC cooling, dehumidification and air delivery, through to photovoltaic-battery storage integration. Their proprietary light-temperature coordination strategy can reduce energy storage requirements by up to 40%.
Research findings have been published in Nature sub-journals and Applied Energy, with projects funded by the National Natural Science Foundation of China, the Shanghai Municipal Science and Technology Commission, and the Shanghai Agriculture Commission. The team has established a full intellectual property system spanning from core algorithms to engineering solutions.
Reference
Photovoltaic-battery integration strategy in plant factories with artificial lighting
Thomas Xiong, Wenyi Cai, Yue Hu, Mengxuan Song, TingTing Qian*, Hua Bao*
DOI: https://doi.org/10.1016/j.enbuild.2026.117462
Affiliation: Pan-Origin Institute of Future Technology, Shanghai Jiao Tong University; Information Research Institute, Shanghai Academy of Agricultural Sciences
Publication status: Energy and Buildings (In Press), JCR Q1
Open-source framework: Vertical Farm Energy Designer (VFED) - https://github.com/ThomasXIONG151215/vertical-farm-energy-designer
Note: During the initial manuscript submission, the repository was named OpenCROPS (Climate-Responsive Optimizer for Plant System). It has since been uniformly renamed to vertical-farm-energy-designer; the original URL automatically redirects.
Data availability: Measurement data, model code, and optimization results are all open-source.
Appendix: Key Parameter Summary
Baseline case parameters (Shanghai 20-foot container PFAL)
| Parameter Category | Parameter | Value |
|---|---|---|
| System scale | Cultivation area | 16 m2 |
| Container specification | 20-foot standard container | |
| LED lighting | Power density | 152 W/m2 |
| Daily energy range | 10-20 kWh/day | |
| HVAC system | Winter COP | 3.94 |
| Spring COP | 3.85 | |
| Summer COP | 2.73 | |
| Autumn COP | 2.57 | |
| Winter daily energy | <5 kWh/day | |
| Summer daily energy | Up to 25 kWh/day | |
| Total energy | Typical winter day | ~20 kWh/day |
| Peak summer day | >45 kWh/day |
PV system parameters
| Parameter | Value |
|---|---|
| PV module model | Single-diode model |
| Shanghai annual solar resource | 4.0-4.5 kWh/m2/day |
| Lhasa annual solar resource | 5.88 kWh/m2/day |
| Harbin annual solar resource | 3.81 kWh/m2/day |
BES system parameters
| Parameter | Value |
|---|---|
| Battery efficiency | SOC model accounting for charge/discharge efficiency |
| Model uncertainty | +/-2% (per manufacturer specifications) |
| Cycle life assumption | LFP battery standard operating conditions |
Economic evaluation parameters
| Parameter | Value |
|---|---|
| Grid electricity price (fixed) | 0.096 $/kWh |
| Payback period targets | 3-year / 5-year |
| LCOE range | 0.032-0.042 $/kWh |
| Grid dependency target | TGD < 5% (near-energy autonomy) |
Simulation optimization parameters
| Parameter | Value |
|---|---|
| Parameter space | 441 PVBES configs x 24 photoperiod starts |
| Total configurations | 10,584 |
| Photoperiod options | 24 start hours per day |
| Model validation | Full-year (Jan-Dec 2024) measured data in Shanghai |
Five-city system configuration reference (20-foot container PFAL, TGD<5%)
| City | PV Array Area | BES Capacity | Annual Solar Resource |
|---|---|---|---|
| Lhasa | 40 m2 | 40 kWh | 5.88 kWh/m2/day |
| Haikou | 50 m2 | 45 kWh | 4.72 kWh/m2/day |
| Shanghai | 80 m2 | 50 kWh | 4.0-4.5 kWh/m2/day |
| Urumqi | 110 m2 | 45 kWh | 4.21 kWh/m2/day |
| Harbin | 120 m2 | 50 kWh | 3.81 kWh/m2/day |
Note: The above configurations represent the minimum viable system for near-energy autonomy (TGD<5%). Actual projects require localized optimization based on specific site conditions and economic objectives.
Appendix A: Validation of Seasonal Fixed COP Simplification
To verify whether the use of seasonal fixed COP introduces significant bias, the study parallel-tested an hourly COP model accounting for dynamic temperature effects (degradation coefficient 0.025 C-1):
| City | Seasonal Fixed vs Hourly COP Deviation | Direction |
|---|---|---|
| Lhasa | -14.5% | Fixed COP overestimates cold-region cooling |
| Harbin | -9.2% | Fixed COP slightly overestimates |
| Shanghai | +17.2% | Fixed COP underestimates hot-region cooling |
| Haikou | +13.4% | Fixed COP underestimates hot-region cooling |
| Urumqi | - | Essentially consistent |
Monthly economic impact remains within +/-$13/month, confirming that the seasonal fixed COP simplification retains sufficient accuracy within the +/-11% global uncertainty range.
Appendix B: Impact of Battery Degradation on Strategy Robustness
The study tested five battery efficiency levels (80% severe degradation ~ 95% high performance), with baseline of 91% from manufacturer specs.
- The early-morning photoperiod (04:00 start) consistently outperforms the midday strategy (13:00 start) across all efficiency levels, maintaining LCOE advantage of 46.9% to 57.8%.
- Even at 80% efficiency, the core scheduling coordination advantage is not reversed.
- The conclusion holds across all battery degradation stages.